The DAMA Data Management Framework
In short DAMA-DMBOK is to data management roughly what the BABOK® Guide is to business analysis. Its framework has three parts: the DAMA Wheel of knowledge areas, a hexagon of environmental factors, and a standard context diagram that describes each area the same way.
Based on: DAMA International, DAMA-DMBOK: Data Management Body of Knowledge, 2nd ed., ch. 1 “Data Management”.
On this page
Key ideas#
Data management is the discipline of planning, controlling and delivering data as an asset across its whole life cycle. DAMA International’s body of knowledge (DMBOK) defines its scope. It overlaps with business analysis but is a different discipline: the BABOK Guide is about analyzing needs and solutions; DMBOK is about managing data as an asset.
The DAMA Wheel#
The wheel shows 11 knowledge areas. Data governance sits at the center. It is not one area among equals but the function that keeps all the others consistent and balanced. Around it are ten areas: - Data architecture - Data modeling and design - Data storage and operations - Data security - Data integration and interoperability - Document and content management - Reference and master data - Data warehousing and business intelligence - Metadata management - Data quality
Big data and data science have their own chapter in the book but are not part of the wheel graphic. There is no required order for implementing the areas; an organization starts where its needs are greatest.
The environmental factors hexagon#
For each area, DMBOK looks at people, process and technology: - Goals and principles sit in the middle: they determine how to approach the work and which tools to use. - People: roles and responsibilities; organization and culture. - Process: activities. - Technology: techniques and tools.
The hexagon is the key to reading every knowledge area’s context diagram.
The context diagram#
Each knowledge area is described with the same template, built like a SIPOC diagram (suppliers, inputs, process, outputs, customers). It has twelve blocks: 1. Definition: a short description of the area. 2. Goals: its purpose and guiding principles. 3. Activities, in four phases: plan (strategy and tactics, revisited regularly), develop (analysis, design, build, test and deployment around the development life cycle), operate (support, maintenance, improvement) and control (ongoing assurance of quality, integrity, reliability and security). 4. Inputs: often outputs of other areas. 5. Deliverables: often inputs to other areas. 6. Roles and responsibilities: cross-functional, based on the SFIA skills framework. 7. Suppliers. 8. Consumers. 9. Participants. 10. Tools. 11. Techniques. 12. Metrics.
Because every area uses the same blocks, you can compare any two areas side by side.
How to apply it#
- Get oriented fast. When a project touches an unfamiliar data area, such as master data, read its context diagram first. It tells you which inputs, activities, roles and metrics to expect.
- Find stakeholders. The suppliers, consumers and participants in a context diagram make a ready-made stakeholder checklist.
- Tag data requirements by area. Label requirements as security, quality, integration and so on, so the right specialists review them.
- Check governance first. Because governance sits at the center, find out who decides about the data before you propose changes to it.
- Describe a new practice. The 12-block template works for documenting any recurring discipline, including a team’s own data work.
Example#
The Workshop, a fictional chain of 12 bike-repair workshops, is building online booking and repair-status notifications. The analyst walks around the wheel to find data aspects of the requirements: - Data quality: notifications fail if phone numbers are missing or wrong. - Reference and master data: each workshop keeps its own customer and bike records; one shared customer record is needed. - Data integration: parts orders must flow into the supplier’s system. - Data security: customer contact details need protection. - Data governance: nobody has decided what counts as one “customer”, or who fixes bad records.
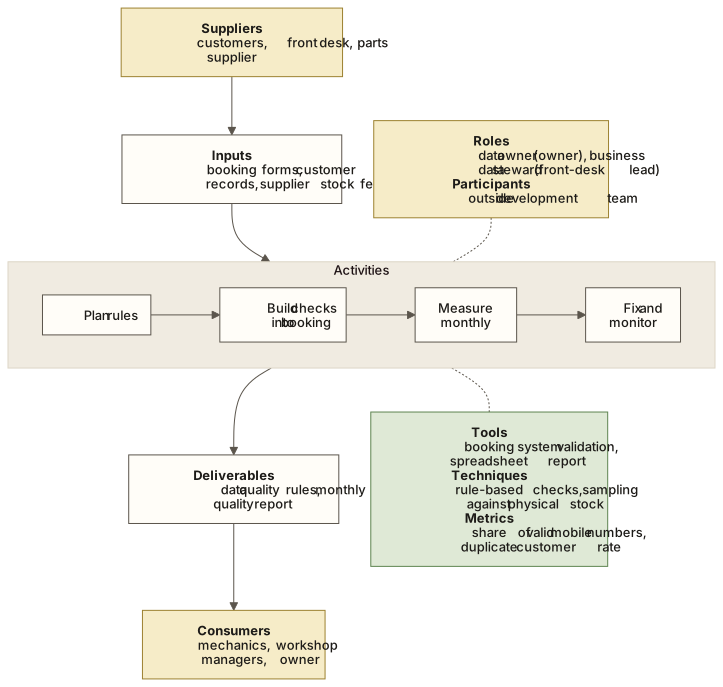
The analyst then sketches a context diagram for “data quality at The Workshop”:
- People and roles
- Inputs and deliverables
- Tools, techniques and metrics
View as text
Definition:   keeping customer, booking and parts data fit for use
Goals:        reliable notifications; accurate stock levels
Activities:   plan rules -> build checks into booking -> measure monthly -> fix and monitor
Inputs:       booking forms, customer records, supplier stock feed
Deliverables: data quality rules, monthly quality report
Roles:        data owner (owner), business data steward (front-desk lead)
Suppliers:    customers, front desk, parts supplier
Consumers:    mechanics, workshop managers, owner
Participants: outside development team
Tools:        booking system validation, spreadsheet report
Techniques:   rule-based checks, sampling against physical stock
Metrics:      share of valid mobile numbers, duplicate customer rate
Pitfalls#
- Treating data management as an IT job → involve business data owners and stewards.
- Trying to cover all eleven areas at once → start with the areas that block your project.
Sources and further reading#
- DAMA International. DAMA-DMBOK: Data Management Body of Knowledge, 2nd ed. Technics Publications, 2017, ch. 1 “Data Management” (the DAMA Wheel, environmental factors hexagon and knowledge area context diagram).